


Utilities: Wednesday Bias
In this analysis, a particular behaviour of the Utilities sector of the S&P500 index is highlighted.
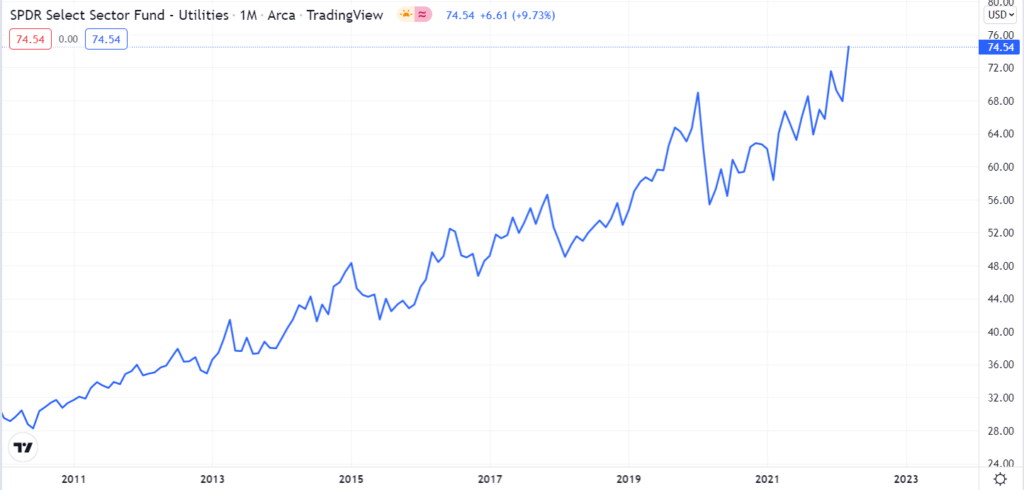
Firgure 1: S&P500 Utilities performance since 2010 (source https://www.tradingview.com/chart/fZxKlgPU/?symbol=NYSE%3AFE)
Since 2010, along with the index, all companies have also experienced an increase in their value, as shown in the tables below.
| Symbol | FE | EXC | NEE | CNP | PPL | DUK | EIX |
| Performance | 5,3% | 45,1% | 637,6% | 130,0% | 4,9% | 127,3% | 112,9% |
| Symbol | PEG | AES | CMS | ETR | NRG | PNW | WEC |
| Performance | 135,2% | 117,7% | 358,4% | 53,4% | 57,7% | 113,3% | 314,2% |
| Symbol | SRE | D | LNT | EVRG | ES | DTE | ED |
| Performance | 240,9% | 124,9% | 297,6% | 21,6% | 246,3% | 270,6% | 116,6% |
| Symbol | AEE | AEP | SO | XEL | ATO | NI | AWK |
| Performance | 267,2% | 187,0% | 126,6% | 248,0% | 335,8% | 464,0% | 660,8% |
However, if we analyse the returns for the different days of the week of the 28 companies that make up the index, we see that in contrast to the upward trend of the index there is a predisposition of almost all companies to have negative returns on Wednesday.
| Symbol | Day | Avg Return | Win Ratio | Profit Factor |
| FE | Wednesday | -0,17% | 0,52 | 1,37 |
| EXC | Wednesday | -0,12% | 0,51 | 1,25 |
| NEE | Wednesday | -0,10% | 0,54 | 1,23 |
| CNP | Wednesday | -0,10% | 0,51 | 1,19 |
| PPL | Wednesday | -0,09% | 0,49 | 1,21 |
| DUK | Wednesday | -0,09% | 0,52 | 1,23 |
| EIX | Wednesday | -0,09% | 0,55 | 1,19 |
| PEG | Wednesday | -0,09% | 0,49 | 1,19 |
| AES | Monday | -0,09% | 0,49 | 1,14 |
| CMS | Wednesday | -0,08% | 0,51 | 1,20 |
| ETR | Wednesday | -0,08% | 0,54 | 1,17 |
| NRG | Tuesday | -0,08% | 0,48 | 1,11 |
| PNW | Wednesday | -0,08% | 0,51 | 1,18 |
| WEC | Wednesday | -0,07% | 0,52 | 1,18 |
| SRE | Wednesday | -0,07% | 0,53 | 1,16 |
| D | Wednesday | -0,07% | 0,53 | 1,18 |
| LNT | Wednesday | -0,05% | 0,50 | 1,12 |
| EVRG | Wednesday | -0,05% | 0,52 | 1,12 |
| ES | Wednesday | -0,04% | 0,50 | 1,10 |
| DTE | Wednesday | -0,04% | 0,51 | 1,09 |
| ED | Wednesday | -0,04% | 0,49 | 1,10 |
| AEE | Wednesday | -0,04% | 0,51 | 1,08 |
| AEP | Wednesday | -0,04% | 0,48 | 1,08 |
| SO | Wednesday | -0,03% | 0,50 | 1,09 |
| XEL | Wednesday | -0,03% | 0,51 | 1,08 |
| ATO | Wednesday | -0,03% | 0,51 | 1,06 |
| NI | Wednesday | -0,01% | 0,50 | 1,02 |
| AWK | Monday | 0,02% | 0,48 | 0,95 |
Table 1. Average return on Wednesday of the stocks composing the S&P500 – Utilities index.
In the table we have also highlighted the only 3 stocks (AES, NRG, AWK) for which the worst performing day of the week is not Wednesday.
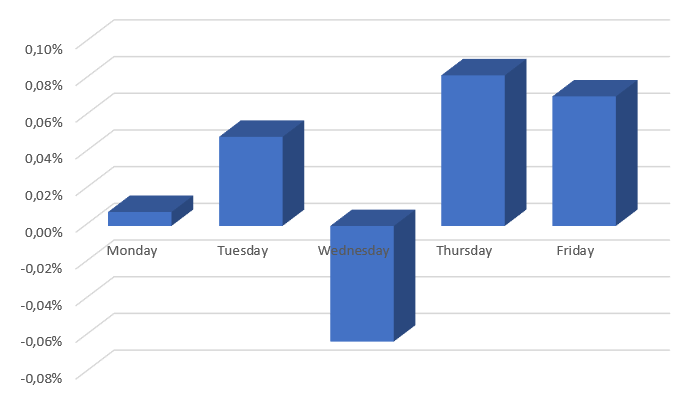
This data becomes more valuable when comparing daily averages by days, taking all shares together.
Figure 1. Mean of all 28 sheres’ avearge return per day
When all the daily returns of the various stocks are combined, it is immediately evident that Wednesday is the only day where performance over the years has been negative.

Giuseppe Ferrulli
CEO, Radiqant





