


Giuseppe Ferrulli
CEO, Radiqant

Mean Reversion
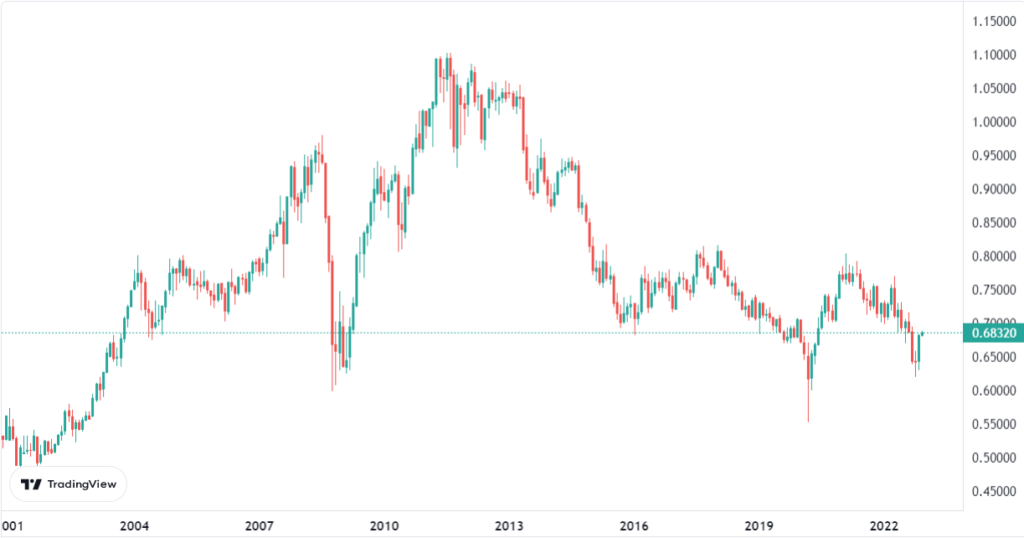
In this analysis we will see how the AUD futures fits into a particular mean reverting strategy.

Mean Reversion
In this analysis, we will consider the CAD futures. Dividing the time series starting in 2002, we will look for the existence of a correlation between the various months.

Mean Reversion
In this analysis we will look at the CHF futures to investigate the presence of any anomalies related to the mean reversion.
Month end Bias
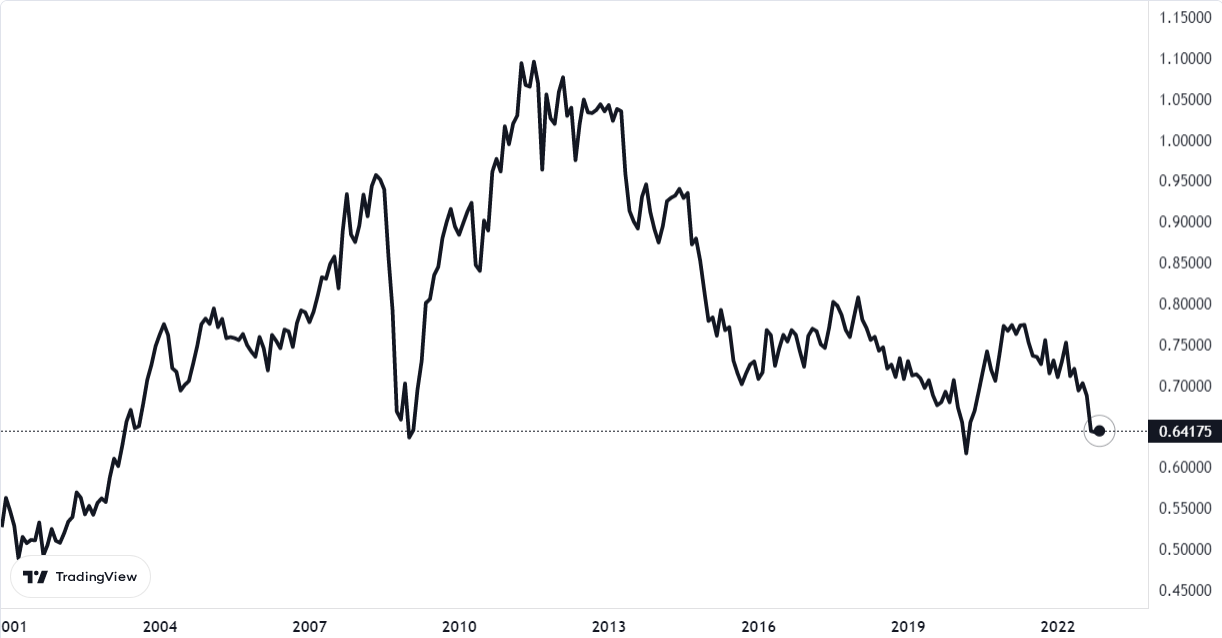
In this analysis we will present a bias in the AUD futures, that recurs in the market with a certain regularity linked to specific days of the month.