
CHF quarterly mean reversion
In this analysis we will look at the CHF futures to investigate the presence of any anomalies related to the mean reversion.
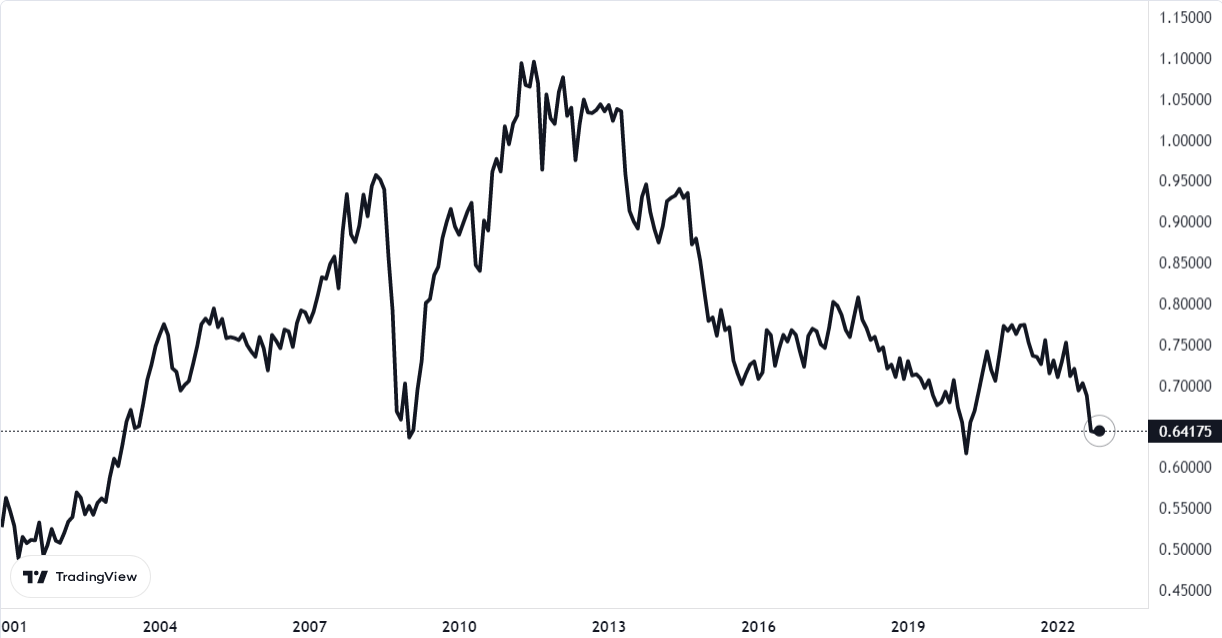
Figure 1 – CHF chart 2001 – 2012 (source: https://it.tradingview.com/symbols/CME-6S1!/)
We then go on to identify the quarters that had a negative return, and then check whether in the following quarter their value appreciated.
|
Year |
Quarter |
Tick Movements |
|
|
2006 |
1 |
Jan-Mar |
-0,0002 |
|
2012 |
1 |
Jan-Mar |
0,0334 |
|
2015 |
1 |
Jan -Mar |
0,0206 |
|
2016 |
1 |
Jan -Mar |
0,0372 |
|
2017 |
1 |
Jan -Mar |
0,0170 |
|
2018 |
1 |
Jan -Mar |
0,0103 |
|
2019 |
1 |
Jan -Mar |
-0,0229 |
|
2022 |
1 |
Jan -Mar |
-0,0500 |
|
2004 |
2 |
Jan -Jun |
0,0086 |
|
2005 |
2 |
Apr-Jun |
-0,0607 |
|
2006 |
2 |
Apr-Jun |
0,0426 |
|
2007 |
2 |
Apr-Jun |
-0,0118 |
|
2009 |
2 |
Apr-Jun |
0,0416 |
|
2010 |
2 |
Apr-Jun |
-0,0215 |
|
2013 |
2 |
Apr-Jun |
0,0058 |
|
2019 |
2 |
Apr-Jun |
0,0113 |
|
2020 |
2 |
Apr-Jun |
0,0107 |
|
2021 |
2 |
Apr-Jun |
0,0086 |
|
2022 |
2 |
Apr-Jun |
0,0211 |
|
2003 |
3 |
Jul-Sep |
0,0156 |
|
2005 |
3 |
Jul-Sep |
-0,0117 |
|
2007 |
3 |
Jul-Sep |
0,0354 |
|
2008 |
3 |
Jul-Sep |
-0,0843 |
|
2010 |
3 |
Jul-Sep |
0,0894 |
|
2012 |
3 |
Jul-Sep |
0,0070 |
|
2014 |
3 |
Jul-Sep |
-0,0816 |
|
2016 |
3 |
Jul-Sep |
0,0013 |
|
2018 |
3 |
Jul-Sep |
0,0039 |
|
2005 |
4 |
Oct-Dec |
-0,0192 |
|
2006 |
4 |
Oct-Dec |
0,0122 |
|
2008 |
4 |
Oct-Dec |
0,0351 |
|
2011 |
4 |
Oct-Dec |
-0,0375 |
|
2014 |
4 |
Oct-Dec |
-0,0411 |
|
2015 |
4 |
Oct-Dec |
-0,0295 |
|
2017 |
4 |
Oct-Dec |
-0,0129 |
|
2019 |
4 |
Oct-Dec |
0,0242 |
|
2021 |
4 |
Oct-Dec |
-0,0117 |
Table 1 – List of quarters with corresponding tick movements in which the previous quarter’s performance was negative.
In this first analysis, we have a Win ratio of 60% on 37 trades.
Examining the quarters separately, we find more significant data, shown in Table 2.
|
Quarter |
Win Ratio |
|
|
1 |
Jen-Mar |
63% |
|
2 |
Apr-Jun |
73% |
|
3 |
Jul-Sep |
66% |
|
4 |
Oct-Dec |
33% |
Table 2 – Win ratio per quarter.
As can be seen from the table, CHF’s tendency to respond to a negative quarter loses its effectiveness in the last quarter of the year (October-December).
The one presented here is a basic Mean Reversion Strategy, from which good market entry cues can be derived. In particular, it is possible to optimise the day on which the position is opened, here set as the first operational day for each quarter.

Giuseppe Ferrulli
CEO, Radiqant