CAD futures monthly bias
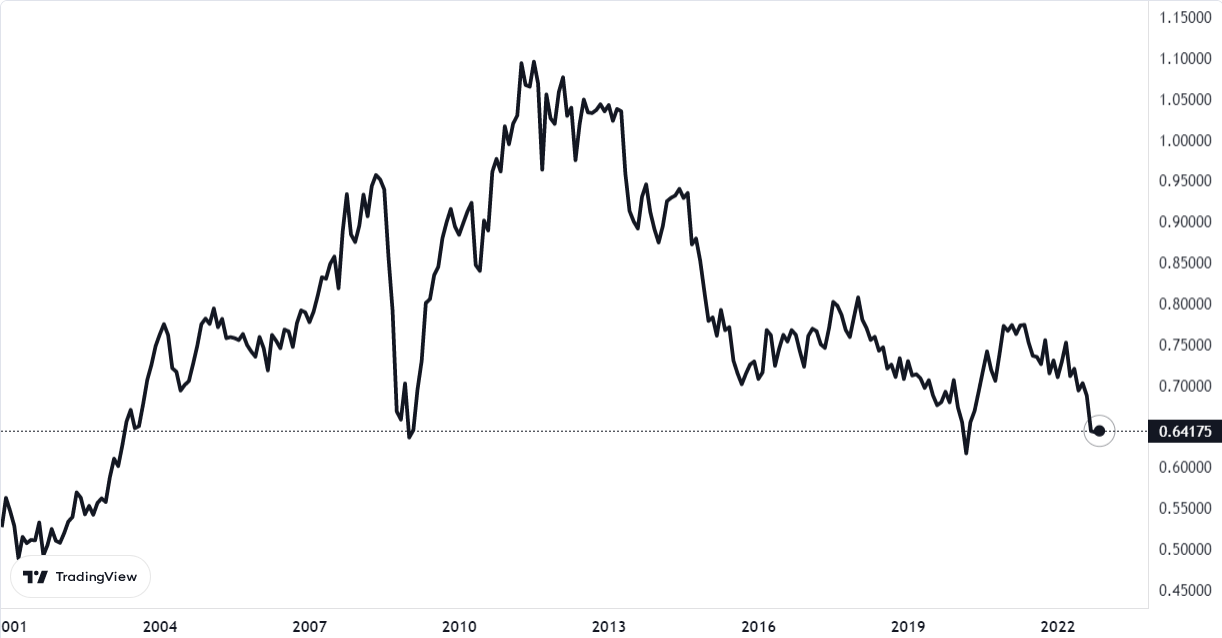
In this analysis, we will consider the CAD futures. Dividing the time series starting in 2002, we will look for the existence of a correlation between the various months.
Figure 1 – CAD chart (source: https://it.tradingview.com/symbols/CME-6C1!/)
The correlation in question is characterized by a positive return in the previous month t-1, accompanied by an appreciation of the futures price in the following month t.
This correlation becomes apparent by distinguishing the months. We thus find March as the month in which the positive return in t-1 (February) occurs 14 times out of the 21 years observed.
|
2002 |
March |
0,0105 |
|
2003 |
March |
0,0071 |
|
2005 |
March |
0,0165 |
|
2006 |
March |
-0,0248 |
|
2007 |
March |
0,0117 |
|
2008 |
March |
-0,0390 |
|
2010 |
March |
0,0344 |
|
2011 |
March |
0,0032 |
|
2012 |
March |
-0,0073 |
|
2014 |
March |
0,0034 |
|
2015 |
March |
-0,0091 |
|
2016 |
March |
0,0318 |
|
2021 |
March |
0,0187 |
|
2022 |
March |
-0,0140 |
Table 1 – List of March tick movements in years when it is preceded by a positive February.
Over these 14 years, the positive February return has been followed by a positive March return 9 times, thus with a Win Ratio of 65% and an average tick movement of 0.0025.
As in all biases based on specific seasonal dynamics, researching, optimising and flanking other biases, even of a different type, will allow one to obtain exit signals that will guarantee better performance.

Giuseppe Ferrulli
CEO, Radiqant