
Radiqant


AUD futures daily range

In this analysis we will see how the AUD futures fits into a particular mean reverting strategy.

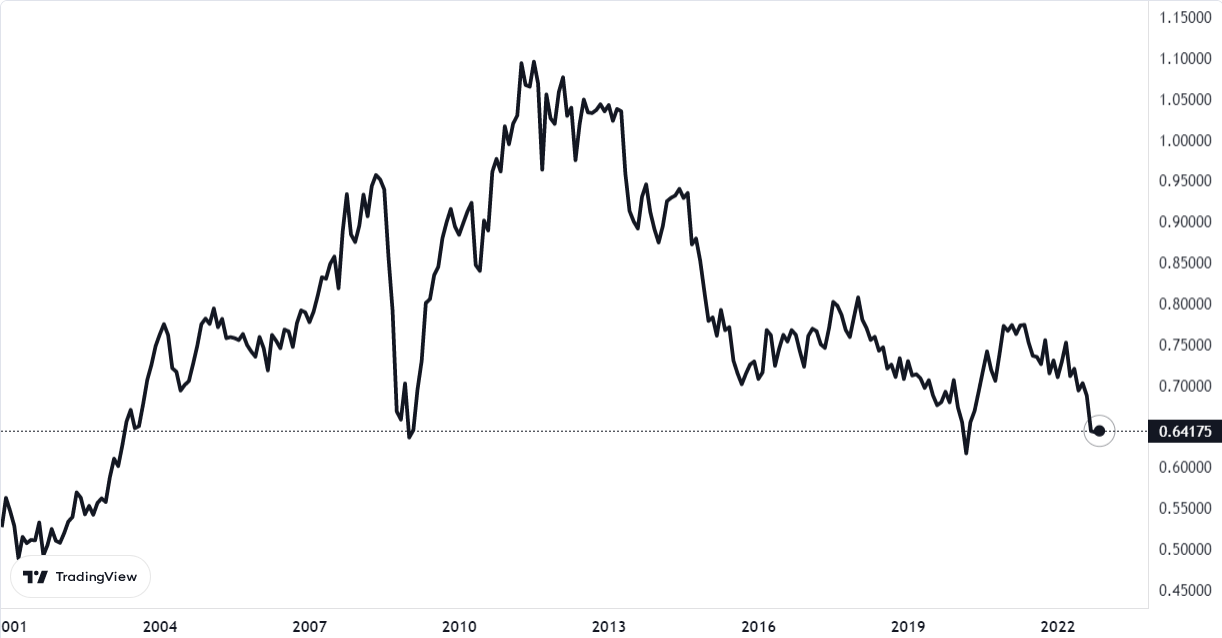
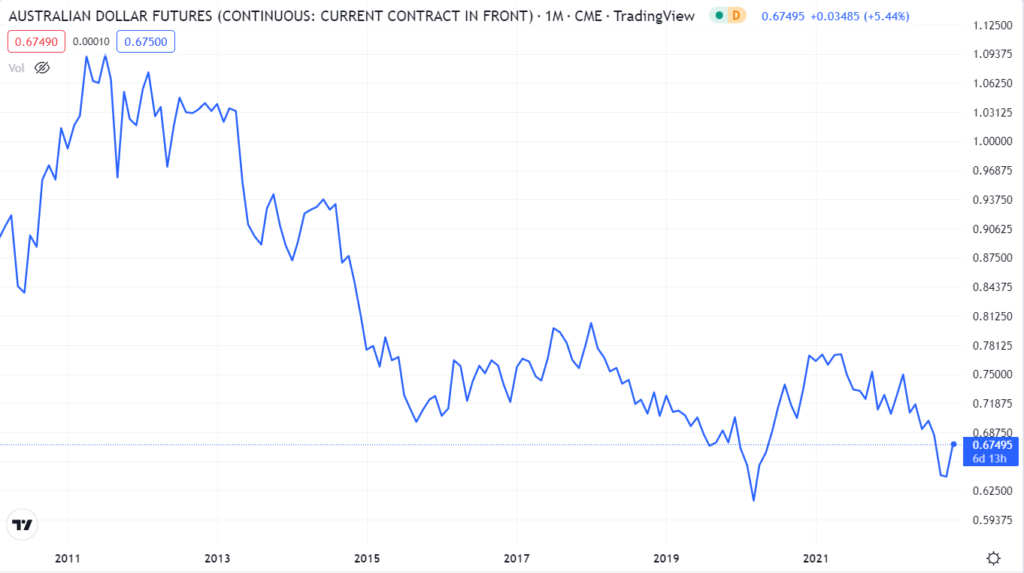
Figure 1 – AUD chart (source: https://it.tradingview.com/chart/?symbol=CME%3A6A1%21)

Taking the series since 2010, we first calculate the moving avarage (aHiLot) of the daily ranges (High-Low) in the previous t days.

aHiLot = (high-Low1 + high-low2 + …+high-lowt)/(t);

We then check day by day whether the future has shown an upward movement to touch or exceed the aHiLot value plus an overHi, the latter measured in tick movements.

The condition is thus:

High-open > aHiLot + overHi

If the condition occurs, we will enter with a short position.

Following this approach, we consider two t-values: one short term, equal to 5 day trading, and the other medium term, equal to 60 day trading. Instead, we take as overHi the tick movements values 0, 20, 40.

Let’s observe in the table below the results obtained.

t

overHi

Total tick movements

Mean tick movements

Total trade

Win Ratio

5

0

-0,0455

-0,0001

330

51,8%

5

0,002

-0,0416

-0,0003

157

52,2%

5

0,004

-0,0097

-0,0001

67

50,7%

60

0

-0,1002

-0,0003

301

56,1%

60

0,002

-0,0634

-0,0005

127

51,2%

60

0,004

-0,0832

-0,0012

67

62,7%


The aHiLo60 has higher win ratio and higher mean tick movements, as the moving avarage has more information given the higher number of days used in calculating the HiLo range. Also, as we can see, a larger overHi leads to better results by finding a better entry and consequently with fewer trades.

Giuseppe Ferrulli

CEO, Radiqant

Share on

Other articles

TREND FOLLOWINGIn this analysis we will consider the AUD futures. Dividing the time series starting in 2003, we will look for an entry that breaks a monthly high-open candle formed the same month as the year before.

Mean Reversion In this analysis, we will consider the CAD futures. Dividing the time series starting in 2002, we will look for the existence of a correlation between the various months.