


Trend-following TSCO with moving averages
In this analysis we make use of the moving average, an indicator used in various strategies to identify the trend reversal point. However, in this case we will search for those actions that best fit a trend-following bullish strategy through the use of such indicators.
One of the stocks that fits best is Tractor Supply Company (TSCO), an American retail chain of stores that offers products for home improvement, agriculture, lawn and garden maintenance, livestock, equine and pet care.
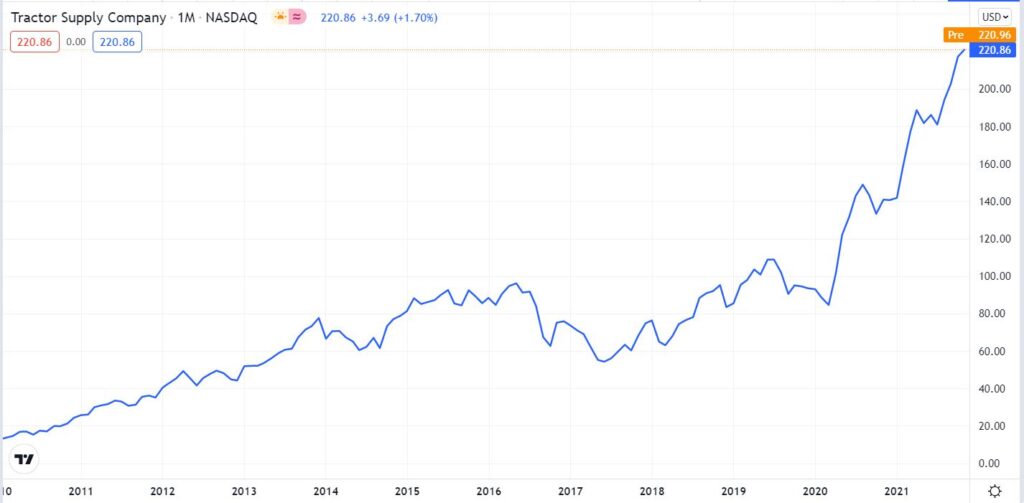
As we can see from Figure 1, starting from 2010 TSCO has two bullish trends: the first from 2010 to the end of 2013; the second from March 2020 onwards.
For this analysis, we will take into account 2 moving averages: a short-term 20-day one and a medium-term 60-day one.
By analysing the two moving averages month by month, we will identify a bullish trend by respecting a simple condition:
Constraint
Throughout the month, MovingAvarage20 must be greater than MovingAvarage 60
If this condition is met, we define the action as a bullish trend, so we will enter the position for the duration of the following month.
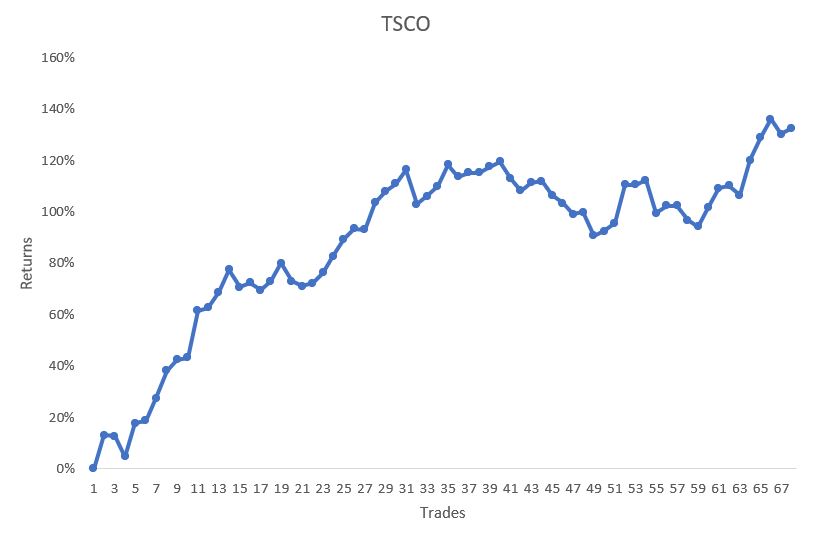
This condition resulted in 67 entry signals, where the average return was 1.98%. 67% of trades were successful with a profit factor of 2.2 and a Sharpe Ratio of 2.5.
The strategy is supported by excellent data, but not optimised in parameters such as entry point, exit point and moving average periods, and finally without any trade management.
Nonetheless, it leads to the cumulative equity line we can see in the figure below.
Figure 2. TSCO cumulative equity line

Giuseppe Ferrulli
CEO, Radiqant





