


Radiqant


CAD Futures: Mean Reverting Bias

In this analysis on CAD futures we will conduct a simple study on the presence of a mean reverting characteristic of the cross, identifying high level asset prices for it to revert to its moving average level, selling high.

The reference point will be the high price of the previous t-1 week increased by a percentage (p1).

When the price exceeds the high of the previous week plus the percentage, that will be our reference point for a short entry.

Therefore:

High weekt > High weekt-1 + p1.

The results of the revenue described above are thus expressed in the table below.

Currency Pair

mean tick

Total Trades

Win Ratio

Profit factor

CAD

-0,00117

148

0,59

1,8

Table 1 – Statistics of the short entry on the Cad futures.

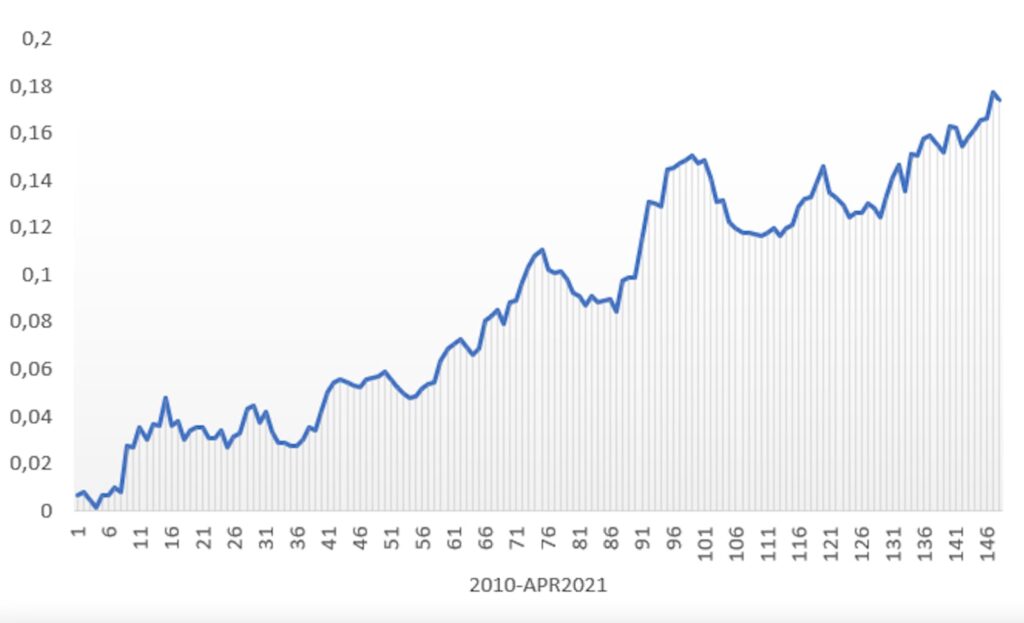
As we see from the table, there is a win ratio of 59% with 148 trades, with an average tick increment of -$0.00117, where the Minimum Tick Size is $0.0001 per increment. The profit factor of the 148 trades is 1,8 .

The resulting cumulative tick movements line will be as shown in the figure below.

Figure 1 – CAD futures cumulative tick movements.


Year

Tick movements

2010

-0,0298

2011

0,0011

2012

-0,0276

2013

0,0023

2014

-0,0288

2015

-0,0198

2016

-0,0422

2017

0,0282

2018

-0,0184

2019

0,0064

2020

-0,0335

2021

-0,0126

Table 2 –  Revenue results on CAD futures per year.

Giuseppe Ferrulli

CEO, Radiqant

Share on

Other articles

TREND FOLLOWINGIn this analysis we will consider the AUD futures. Dividing the time series starting in 2003, we will look for an entry that breaks a monthly high-open candle formed the same month as the year before.

Mean Reversion In this analysis, we will consider the CAD futures. Dividing the time series starting in 2002, we will look for the existence of a correlation between the various months.

