


Radiqant


GBP/NZD short on Wednesday

In this article we will look at a particular behavior of the GBP NZD currency future, which has been fairly constant over time.

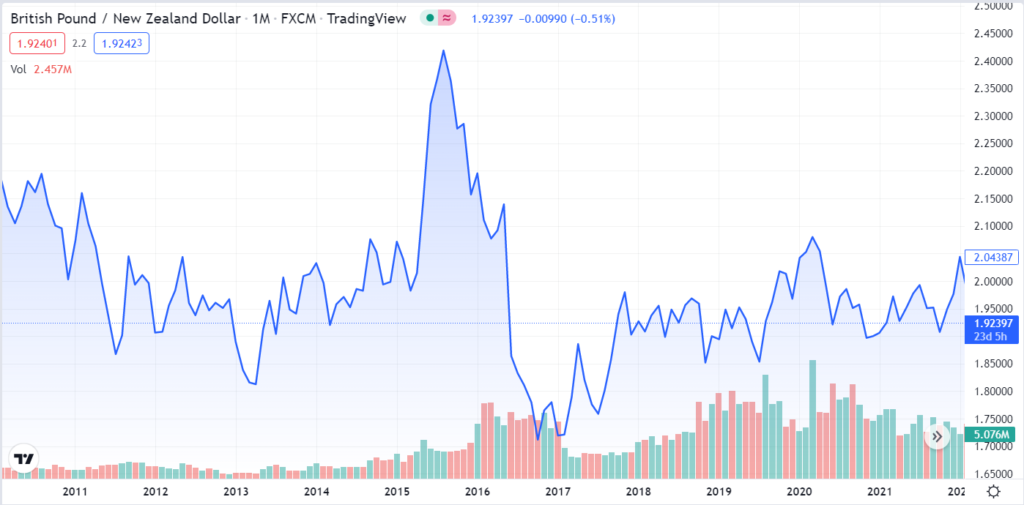
Since 2010, GBP NZD, excluding a marked up and down between 2015 and 2017, has had a stable trend in its price, as we can see from the following chart.

Figure 1 – The graph shows the price trend for GBP/NZD currency futures (source: https://www.tradingview.com/chart/?symbol=FX%3AGBPNZD)

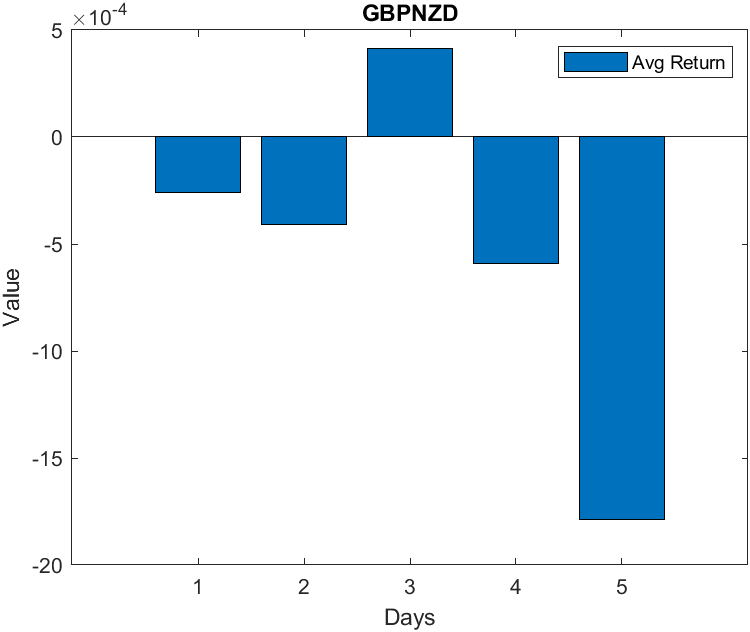
Analyzing price changes for different days of the week, we identify a predisposition of GBP/NZD to have negative returns on Friday, accompanied by marked volatility.

Figure 2 – GBP/NZD’s Avearge tick movements per day

Day of the week

Mean tick movements

Win ratio

Profit factor

1

Monday

-0,00026

0,52

1,05

2

Tuesday

-0,00041

0,50

1,07

3

Wednesday

0,00041

0,50

1,08

4

Thursday

-0,00059

0,52

1,10

5

Friday

-0,00179

0,57

1,37

As we can see from the table 1, the win ratio and profit factor values are higher than on other days, but more importantly, the volatility toward negative returns is largely larger than the average tick movements on other days – as can be clearly understood from Figure 2.

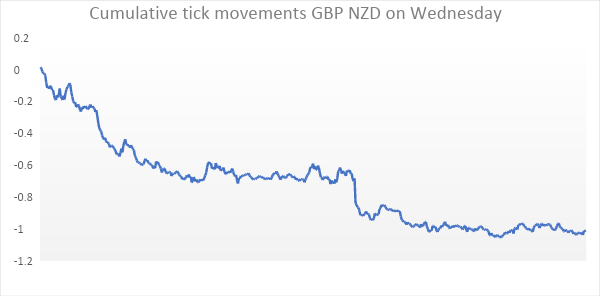
The resulting cumulative tick movements line will be as shown in the figure below.

Figure 3 – GBP/NZD’s Cumulative tick movements on Wednesday

Giuseppe Ferrulli

CEO, Radiqant

Share on

Other articles

TREND FOLLOWINGIn this analysis we will consider the AUD futures. Dividing the time series starting in 2003, we will look for an entry that breaks a monthly high-open candle formed the same month as the year before.

Mean Reversion In this analysis, we will consider the CAD futures. Dividing the time series starting in 2002, we will look for the existence of a correlation between the various months.

