


EUR/CHF before and after 60-minute break
In this analysis we will look at the EUR/CHF futures and present a bias linked to two different times of the trading day.
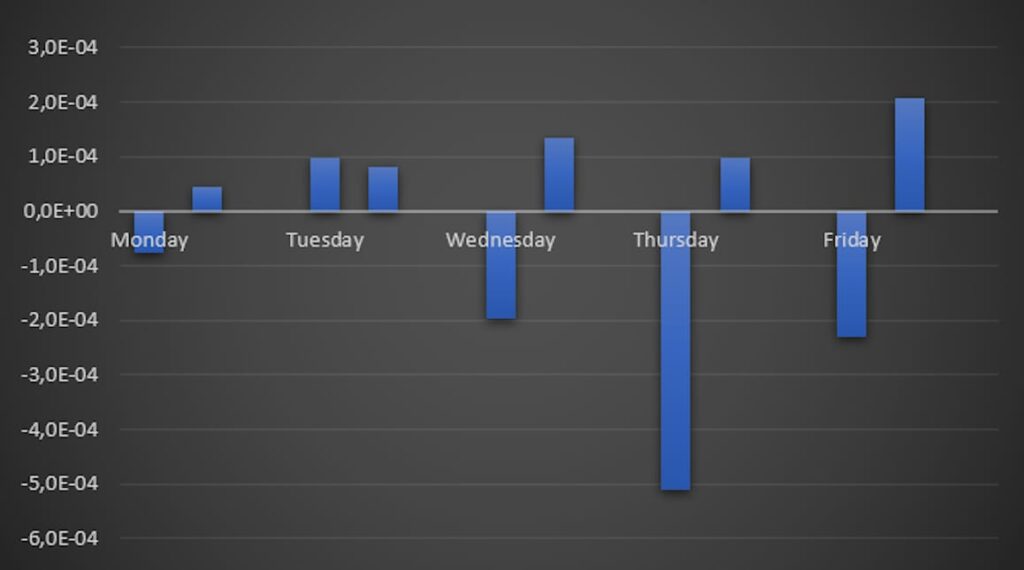
Let’s look at the time series since 2010 and divide the trading day into two parts, before and after the 60-minute daily break starting at 6:00 p.m. NY. More precisely, from midnight to 6:00 p.m. and from 7:00 pm 11:59 p.m. We thus obtain the following behaviour of the futures in terms of average tick movements.
|
Mon |
Tue |
Wed |
Thur |
Fri |
|||||
|
-0,7 |
0,5 |
0,9 |
0,8 |
-2 |
1,4 |
-5,1 |
0,9 |
-2,3 |
2,1 |
Table 1 – EUR/CHF mean tick movements per day, before and after 60-minute break.
Figure 1 – EUR/CHF mean tick movements per day, before and after 60-minute break.
Excluding Tuesdays, the first part of the day from midnight to 6:00 p.m. is always negative. The second part, from 07:00 p.m. to 11:59 p.m., on the other hand, is always positive.
The positive retracement after 7:00 p.m. is more pronounced if the negative return of the first part of the day is larger than average.
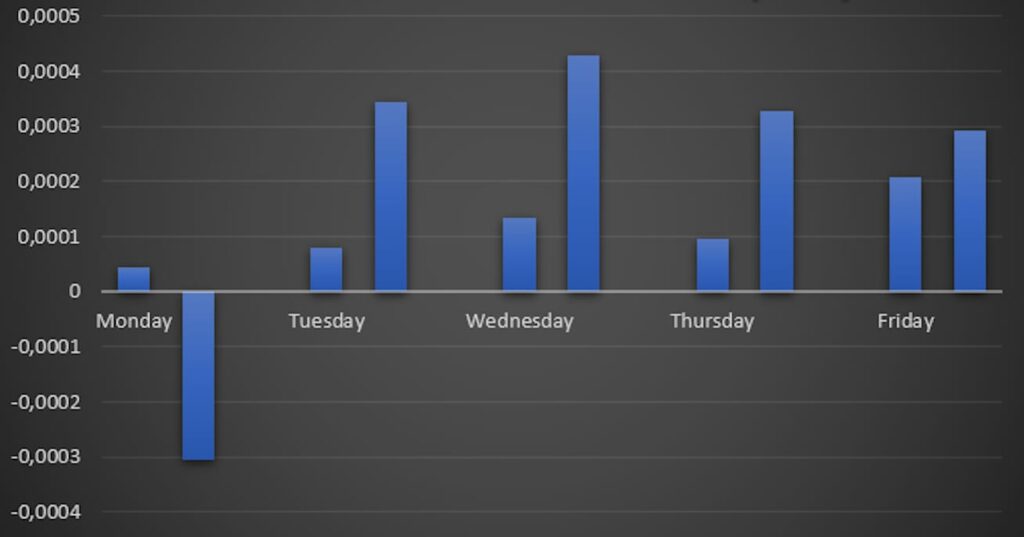
Thus, by identifying the days when the negative return is below – 0.25% in the first part, the positive returns in the second part increase. We observe the results in the table and image below.
|
Mon |
Tue |
Wed |
Thur |
Fri |
|||||
|
0,5 |
-3 |
0,8 |
3,5 |
1,4 |
4,3 |
0,9 |
3,3 |
2,1 |
2,9 |
Table 2 – EUR/CHF average tick movements per day of the week, from 07:00 p.m. to 11:59 p.m. For each day, the column on the left refers to an ordinary scenario, while the column on the right refers to the case where in the first part (from midnight to 6:00 p.m.) there was a return of less than -0.25%.
As we see from Figure 2, this increase occurs on all days except Monday, which continues the negative trend of the day.

Giuseppe Ferrulli
CEO, Radiqant





