


CAD futures daily range
In this analysis we will see how the CAD futures fits into a particular mean reverting strategy.
In the first place we are going to calculate the average daily range aDR = High Low that the future has had since 2010. For comparison we will also calculate the average daily High – Open (aHO) and Open – Low (aLO). The results are summarized in the table below.
|
2010 |
2011 |
2012 |
2013 |
2014 |
2015 |
2016 |
2017 |
2018 |
2019 |
2020 |
|
|
aDR |
0,0107 |
0,0100 |
0,0065 |
0,0058 |
0,0057 |
0,0073 |
0,0070 |
0,0055 |
0,0053 |
0,0038 |
0,0055 |
|
aHO |
0,0055 |
0,0048 |
0,0033 |
0,0026 |
0,0027 |
0,0034 |
0,0036 |
0,0029 |
0,0024 |
0,0019 |
0,0028 |
|
aLO |
0,0052 |
0,0052 |
0,0032 |
0,0032 |
0,0030 |
0,0039 |
0,0034 |
0,0026 |
0,0029 |
0,0019 |
0,0027 |
Table 1 – aDR, aHO, aLO over the years.
As we can see from the table, daily volatility – more precisely, its price range (High – Low) – takes on very different values over the years, alternating between years of high volatility and years of low volatility. On the other hand, the ranges of its positive aHO and negative aLO returns are distributed almost equally.
After finding the yearly averages of the daily ranges, we are going to identify the sessions where:
- the high produced a movement above the average daily range of the ‘previous year, so (High – Opening) > aDRt-1 ;
- the low produced a movement above the average daily range of the ‘previous year, so (Opening – Low) > aDRt-1 ;
In the two cases the price movement deviates significantly from its opening, significantly if we consider its aHO and aLO. We will thus use the aDR as resistance and support.
Once one of the two conditions occurs, market entry will be toward the opposite direction of that movement (Short or Long). Let’s see the results this strategy would bring by holding the positions until the close of the day.
- Short trades, totaling 266 trades, have a Win Ratio of 57 %, a Profit Factor of 1.53 and total tick movements of 1154;
- LONG trades, with a total of 295 trades have a wr of 56 %, a profit factor of 1.33 and with an total tick movements of 909.
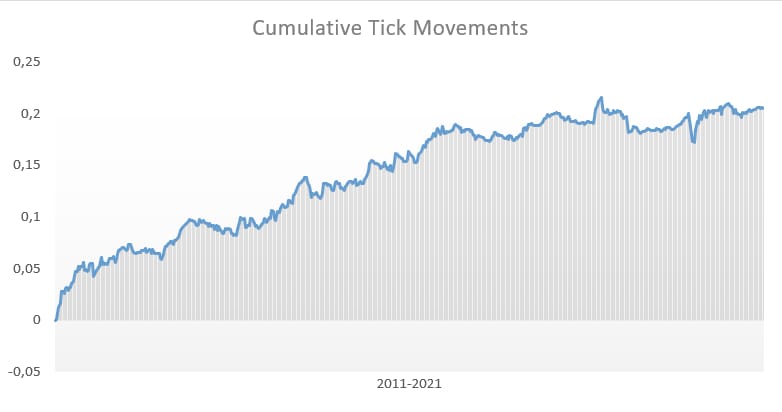
The two conditions lead to the following equity line of cumulative tick movements.
Figure 1 – Cumulative Tick Movements
From this analysis we can infer that NZD respects its daily ranges to a great extent. In addition, an aDR calculated over a shorter interval, and not over a year, would better capture market conditions.

Giuseppe Ferrulli
CEO, Radiqant





