


AUD/NZD Mean Reverting Time Bias
In this analysis based on AUD/NZD currency futures, we will conduct a simple but informative study. We will focus on the presence of a mean reverting characteristic of the cross: not on the classic phenomena of interest such as asset prices of returns eventually revert to their long-term moving average levels (buying low and selling high); in our case, the average will be the reference point for the identification of an hourly bias. When at a given time the price is above or below the average, the job will be to find a regularity in the way the price moves.
In this specific case, we will use a short-term 15-period moving average in an hourly time frame, so that it responds more responsively to our hourly study. Furthermore, the investigation will take place on prices that are above the MA15.
We thus find the mean reverting time bias of 12.00, whose data are summarised in the following table.
|
Currency Pair |
Hour |
Mean tick |
Total Trades |
Win Ratio |
Profit factor |
|
AUD/NZD |
12.00 (NY) |
-0,00023 |
1418 |
0,58 |
1,7 |
Table 1. Table shows the highlights of the mean reverting time bias
In the table, the time refers to the NY time zone. At this time, we will find 1418 trading days where the price is above the MA15. 58% of the time the price returns to the mean, with an average tick size of -0.00023$, where the minimum tick size is 0.0001$ per increment. The profit factor of the 1418 trades is 1,7.
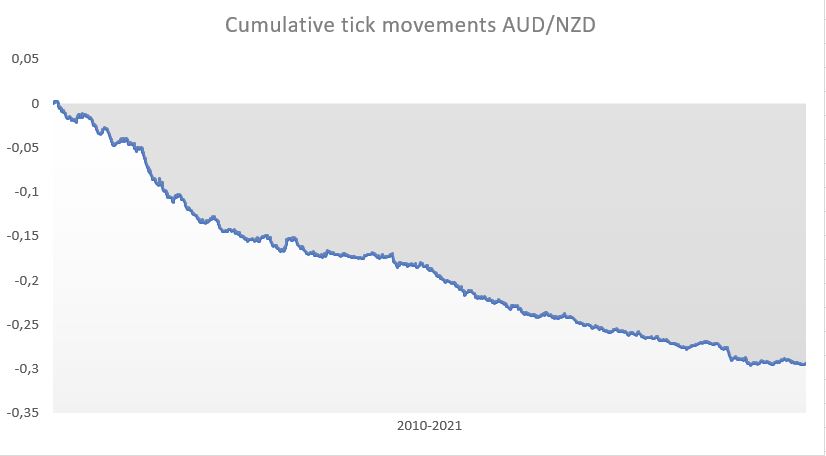
The resulting cumulative tick movements line will be as shown in the figure below.
Figure 1. Figure shows cumulative tick movements of the bias from 2010 to July 2021
|
Year |
Tick movements |
|
2010 |
-0,0425 |
|
2011 |
-0,0787 |
|
2012 |
-0,0340 |
|
2013 |
-0,0186 |
|
2014 |
0,0020 |
|
2015 |
-0,0362 |
|
2016 |
-0,0238 |
|
2017 |
-0,0177 |
|
2018 |
-0,0154 |
|
2019 |
-0,0063 |
|
2020 |
-0,0186 |
|
2021 |
-0,0043 |

Giuseppe Ferrulli
CEO, Radiqant





