
Radiqant


Healthcare: Incorrelation with S&P500 Index

This analysis highlights how some companies in the S&P500 index do not always follow the trend of their benchmark.

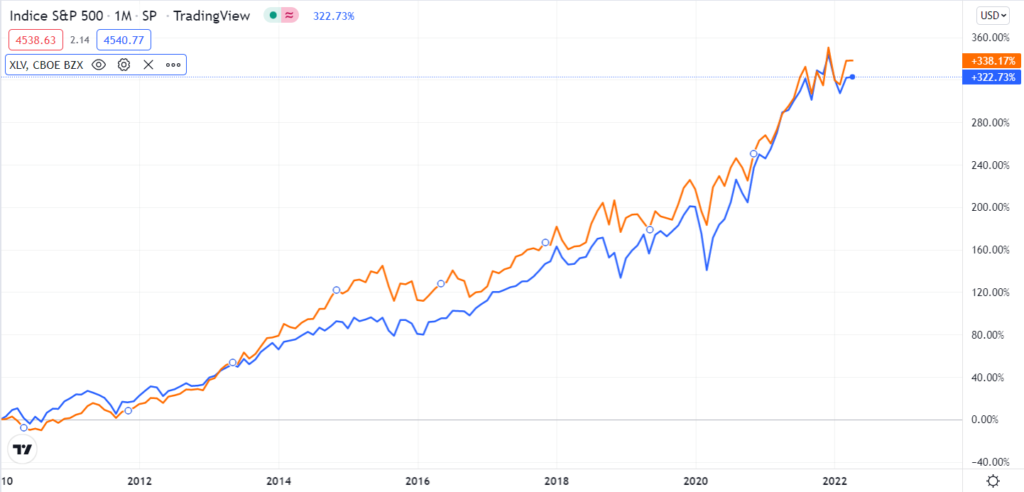
Let’s consider the S&P500 Health Care Select Sector, which includes companies that are classified as members of the GICS® health care sector. 

Figure 1 S&P500 Index Vs S&P500 Health Care Select Sector ETF (source: https://it.tradingview.com/chart/fZxKlgPU/?symbol=CME%3ASU1%21)

As we can see from Figure 1, the two indexes show a high correlation on a monthly timeframe, but when analysing the stocks under the helthcare index individually we notice that they do not always respect this relationship.

In general, 29 out of 53 stocks have a correlation index with the SP500 of less than 0,5.

In addition, the months since 2010 in which the S&P500 index had a positive performance were considered. Once these positive months were identified, the differences (D) of the returns between the Health Care Select Sector and the S&P500 index were found: we thus note that 35 out of 53 stocks on average have lower returns than the S&P500. 

The 3 stocks that most underperform the S&P500 index are shown in the table below:

Ticker

D

Win Ratio (a)

Correlation

Win Ratio (b)

PRGO

-1,89%

0,65

0,38

0,48

BMY

-1,35%

0,63

0,33

0,4

LLY

-1,18%

0,57

0,25

0,38

Table 1: The table shows the behaviour since 2010 of the three stocks that most underperform the S&P500 Index.

As can be seen from Table 1, the monthly correlations with the S&P500 are weak, with the differences in returns (D) on average below -1%. The Win Ratio (a) column indicates the percentage of stock underperformance in positive S&P500 months. Win ratio (b) indicates the percentage of negative stock returns in SP500’s positive months.

Giuseppe Ferrulli

CEO, Radiqant
Share on

Other articles

TREND FOLLOWINGIn this analysis we will consider the AUD futures. Dividing the time series starting in 2003, we will look for an entry that breaks a monthly high-open candle formed the same month as the year before.
Mean Reversion In this analysis, we will consider the CAD futures. Dividing the time series starting in 2002, we will look for the existence of a correlation between the various months.