
Time-band bias in EUR/NZD currency futures
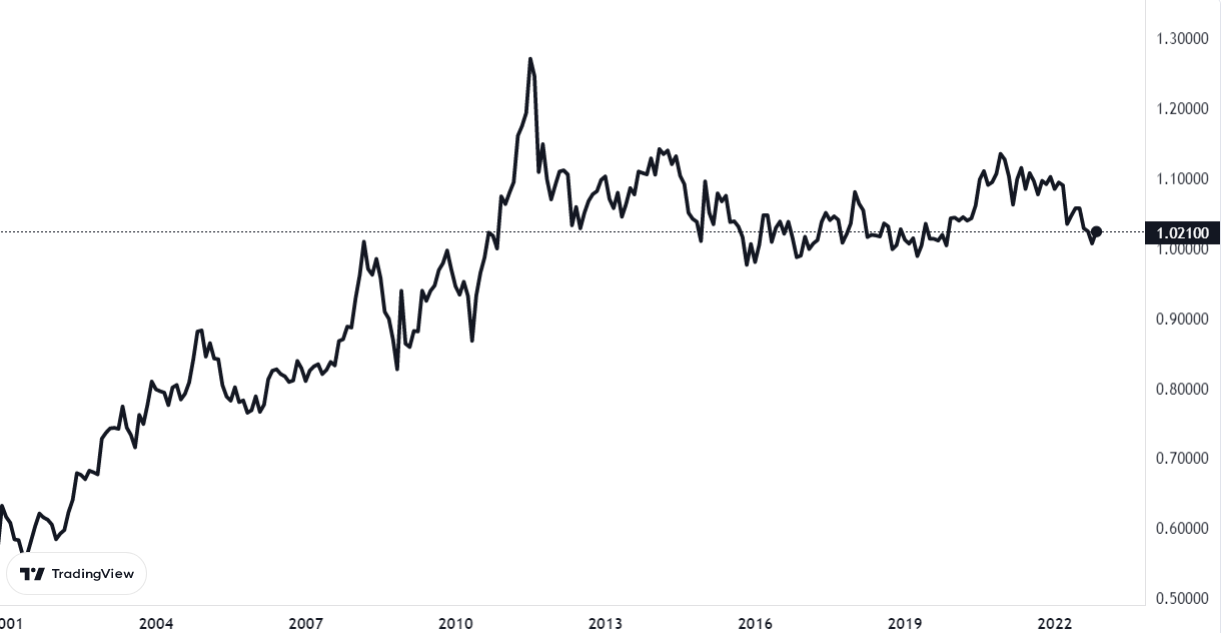
In this analysis we will present a Time-band Bias identified in EUR/NZD currency futures.
This present time series is analysed on an hourly time frame starting from May 2007.
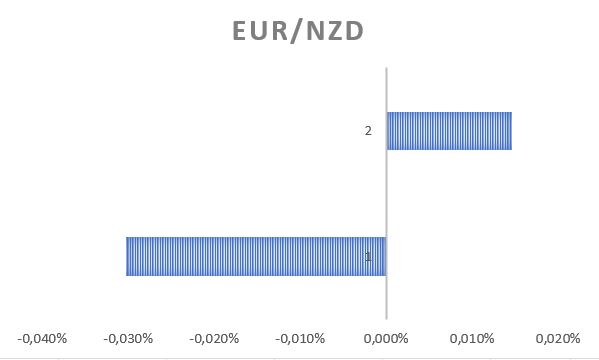
Each day was divided into two parts: 00:00 – 12:00 (NY) and 12.00-23.00 (NY). In doing so, there was a clear tendency for EUR/NZD to go short in the first part, as we can see from Figure 2.
Figure 1. Average return 00:00 – 12:00 (1); 12:00 – 23:00 (2).
As we can see from Figure, the first part of the day shows an average return in absolute value that is double that of the second part.
Subsequently, we have narrowed down the number of hours and days of the week, focusing on those that present a more evident tendency to go short.
Identifying as a band of hours that of the 1.00-9.00 and as days to hold in consideration the Wednesday, the Thursday and the Friday, and then exploiting the autocorrelations of negative returns where the conditional heteroschedasticity hypothesis presents larger shocks in the case of negative returns, we filter out the first part by identifying the negative increasing returns on the two days immediately preceding.
Constraints
1. 1.00-9.00 (NY)
2. Wednesday, Thursday, Friday
3. Lastly, we define that the sum of the returns on day t-1 must be less than the difference between the average of the hourly returns recorded on day t-2 and the doubled-standard deviation of the hourly returns on day t-2, as stated in the formula below.
(Σi=00:00 – 23:00 xi)t-1 < (μ – 2σ)t-2
x = hourly yields
t = day taken into account
i = 00:23 -> hours taken into account
μ = average hourly yields
σ = Standard deviation of hourly yields
Taking twice the dev.st we filter out and get 5% of the most extreme returns of the normal distribution.
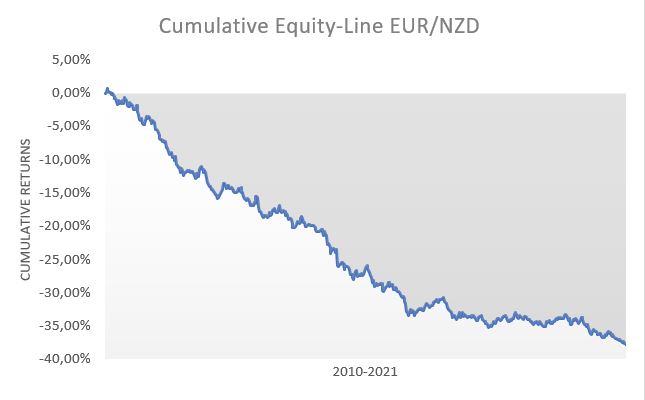
Respecting these constraints and starting this time from 2010 – thus eliminating the great volatility of the markets during the financial crisis – we get an average return -0.06% , with a Win Ratio of 60% and a Profit Factor of 1.62.
The resulting cumulative equity line will be as shown in the figure below.
|
Year |
YTD |
|
2010 |
-4,11% |
|
2011 |
-7,73% |
|
2012 |
-2,82% |
|
2013 |
-2,25% |
|
2014 |
-6,45% |
|
2015 |
-6,39% |
|
2016 |
-2,40% |
|
2017 |
-1,26% |
|
2018 |
0,44% |
|
2019 |
-0,92% |
|
2020 |
-3,01% |

Giuseppe Ferrulli
CEO, Radiqant