


Radiqant

Low-volatility anomaly in SPN

This analysis will focus on the low-volatility anomaly, taking into consideration the Energies sector of the S&P500 index.

Low-volatility investing is an investment style which involves buying stocks or securities with low volatility and avoiding those with high volatility.This investment style exploits the low-volatility anomaly

According to financial theory, risk and return should be positively related, however in practice this is not true. Low-volatility investors aim to achieve market-like returns, but with lower risk.

The low-volatility anomaly presented in this analysis was detected has been identified on the basis that risk-return relation was too flat, suggesting that risk and return are not always related.

Low-volatility stocks tend to outperform high-volatility stocks in the very long run. Since low-volatility securities tend to lag during bull markets and tend to reduce losses in bear markets, a full business cycle is needed to assess performance.


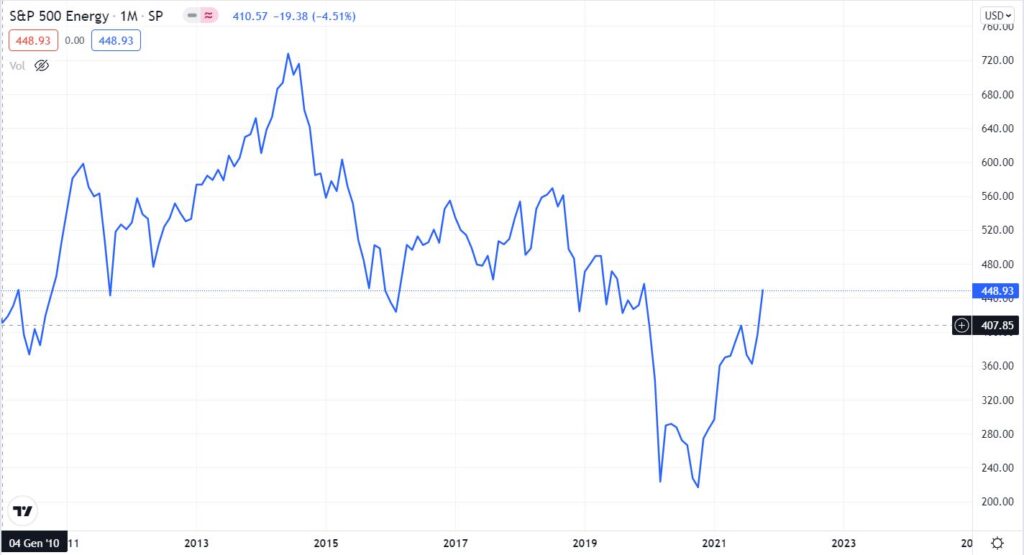
Analysing the energy index (SPN) from 2010 to October 2021 we observe two different trends: a bullish one until mid-2014 and a bearish one that goes from mid-2014 until the reversal of the trend started in the last months of 2020.

Figure 1. SPN monthly chart (source: https://it.tradingview.com/chart/?symbol=SP%3ASPN)

Over this period of more than 10 years, the index has performed slightly positively: its value in October 2021 (448 points) is at 2010 levels (407).

Since we have a fairly long time-span, we can identify stocks that had low volatility.

Symbol

Dev.st (daily)

R

Market Cap, $K 

XOM 

1,5%

-1,70%

267,222,496

CVX 

1,7%

50,47%

218,145,280 

COP 

2,2%

95,28%

101,395,288 

Table 1. Top 3 low-volatility stocks 

The three stocks with the lowest volatility – Exxon Mobil Corp (XOM), Chevron Corp (CVX), Conocophillips (COP) – are also the three stocks with the highest market capitalization. XOM, CVX and COP on average outperform their sector index.

As we can see from the figure below, despite the fact that these stocks are highly correlated with their index – partly because of their high capitalization – they have maintained performance above it.

Figura 2. Jan 2010 – Oct 2021 performance (source: https://it.tradingview.com/chart/?symbol=SP%3ASPN)

Symbol

Dev.st (daily)

R

Market Cap, $K 

DVN

2,9%

-37,11%

27,377,880 

MRO

3,2%

-17,37%

13,071,655

APA

3,4%

-72,89%

10,463,649

Table 2. Top 3 high-volatility stocks

Devon Energy Corp (DVN), Marathon Oil Corp (MRO), APA Corp (APA) significantly underperformed the SPN index.

The low-volatility anomaly in risk-return relation shows up in the comparison of data:

Risk (σ)

Return

Top 3 low-volatility stocks

1,8%

48%

Top 3 high-volatility stocks

3,3%

-42%

Table 3. Average risk and average return compared

The portfolio made up of the top three low-volatility stocks (Table 1) has an average volatility that is almost two times lower than the portfolio made up of the top three high-volatility stocks (Table 2). This lower risk translates into a higher average return, whereas the high-volatility portfolio (Table 2) even has a negative average return. 

Thus, the energy stocks in the S&P500 index analyzed in this study contradict the high risk – high return assumption.

Giuseppe Ferrulli

CEO, Radiqant

Share on

Others articles

TREND FOLLOWINGIn this analysis we will consider the AUD futures. Dividing the time series starting in 2003, we will look for an entry that breaks a monthly high-open candle formed the same month as the year before.

Mean Reversion In this analysis, we will consider the CAD futures. Dividing the time series starting in 2002, we will look for the existence of a correlation between the various months.

