
Radiqant


CHF quarterly mean reversion

In this analysis we will look at the CHF futures to investigate the presence of any anomalies related to the mean reversion.

Let’s begin by dividing the time series into quarters starting from 2003.

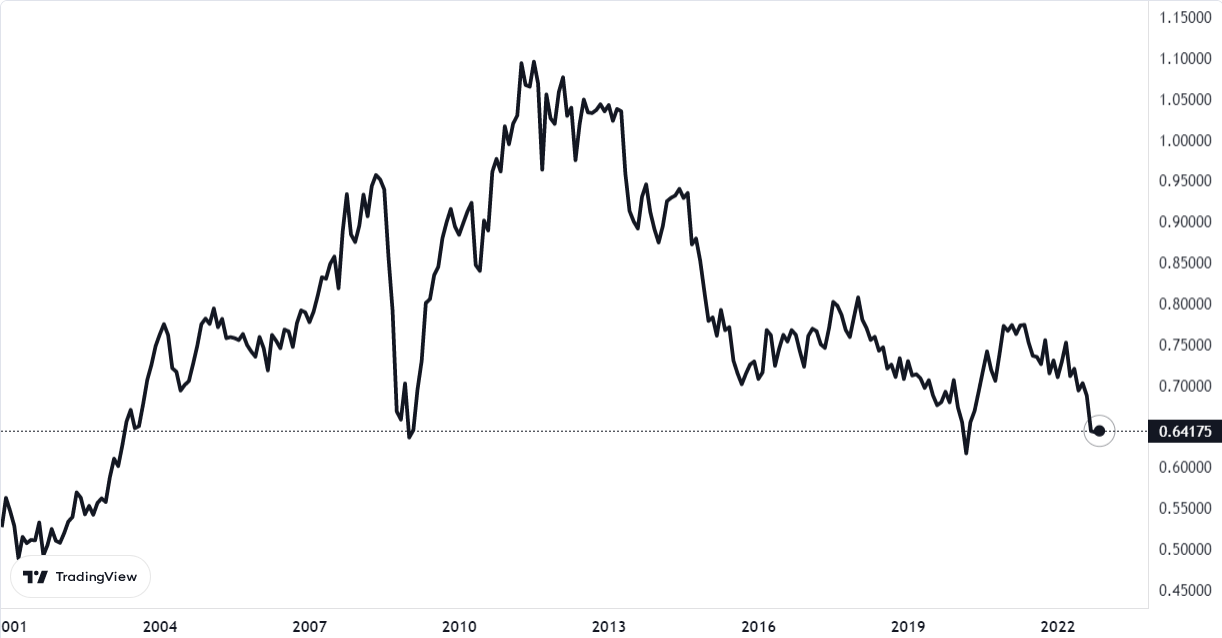
Figure 1 CHF chart 2001 – 2012 (source: https://it.tradingview.com/symbols/CME-6S1!/)

We then go on to identify the quarters that had a negative return, and then check whether in the following quarter their value appreciated.

Year

Quarter

Tick Movements

2006

1

Jan-Mar

-0,0002

2012

1

Jan-Mar

0,0334

2015

1

Jan -Mar

0,0206

2016

1

Jan -Mar

0,0372

2017

1

Jan -Mar

0,0170

2018

1

Jan -Mar

0,0103

2019

1

Jan -Mar

-0,0229

2022

1

Jan -Mar

-0,0500

2004

2

Jan -Jun

0,0086

2005

2

Apr-Jun

-0,0607

2006

2

Apr-Jun

0,0426

2007

2

Apr-Jun

-0,0118

2009

2

Apr-Jun

0,0416

2010

2

Apr-Jun

-0,0215

2013

2

Apr-Jun

0,0058

2019

2

Apr-Jun

0,0113

2020

2

Apr-Jun

0,0107

2021

2

Apr-Jun

0,0086

2022

2

Apr-Jun

0,0211

2003

3

Jul-Sep

0,0156

2005

3

Jul-Sep

-0,0117

2007

3

Jul-Sep

0,0354

2008

3

Jul-Sep

-0,0843

2010

3

Jul-Sep

0,0894

2012

3

Jul-Sep

0,0070

2014

3

Jul-Sep

-0,0816

2016

3

Jul-Sep

0,0013

2018

3

Jul-Sep

0,0039

2005

4

Oct-Dec

-0,0192

2006

4

Oct-Dec

0,0122

2008

4

Oct-Dec

0,0351

2011

4

Oct-Dec

-0,0375

2014

4

Oct-Dec

-0,0411

2015

4

Oct-Dec

-0,0295

2017

4

Oct-Dec

-0,0129

2019

4

Oct-Dec

0,0242

2021

4

Oct-Dec

-0,0117

Table 1 – List of quarters with corresponding tick movements in which the previous quarter’s performance was negative.

In this first analysis, we have a Win ratio of 60% on 37 trades.

Examining the quarters separately, we find more significant data, shown in Table 2.

Quarter

Win Ratio

1

Jen-Mar

63%

2

Apr-Jun

73%

3

Jul-Sep

66%

4

Oct-Dec

33%

Table 2 – Win ratio per quarter.

As can be seen from the table, CHF’s tendency to respond to a negative quarter loses its effectiveness in the last quarter of the year (October-December).

The one presented here is a basic Mean Reversion Strategy, from which good market entry cues can be derived. In particular, it is possible to optimise the day on which the position is opened, here set as the first operational day for each quarter.

Giuseppe Ferrulli

CEO, Radiqant

Share on

Other articles

TREND FOLLOWINGIn this analysis we will consider the AUD futures. Dividing the time series starting in 2003, we will look for an entry that breaks a monthly high-open candle formed the same month as the year before.

Mean Reversion In this analysis, we will consider the CAD futures. Dividing the time series starting in 2002, we will look for the existence of a correlation between the various months.